|
| ||||||||||||||||||||||||||||||||||||||||||||||
|
Section: Science Life |
deutsche Version  Print-Version |
|
Plant sciences Software makes gene activity visible | |
|
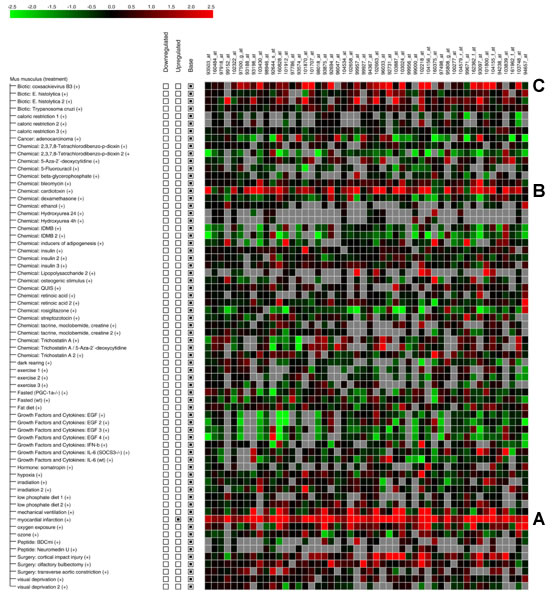
When genes show activity it can be measured, but what is to be done with the growing amount of data? In the last three years ETH Zurich researchers have developed an instrument that allows scientists to analyse and assess data from gene expression experiments on-line. The tool is becoming ever more refined. Peter Rüegg Research in decoding genes and genomes is advancing ever further. The DNA base sequences of various organisms including humans were determined during the past 15 years. On this basis researchers have developed techniques to measure the activities of genes. For example they can use expression experiments nowadays to show which genes become active under particular conditions. It is now possible to record the activity of up to 50,000 genes on a single “GeneChip” with an area of one square centimetre. However, evaluating this data and organising it meaningfully remains as much of a challenge as ever. Efficient access to data Senior scientist Philip Zimmermann in Professor Wilhelm Gruissem’s laboratory at the Institute of Plant Science and his interdisciplinary team have the answer: Genevestigator (1), a software package developed at ETH Zurich that can collect and interpret this kind of chip data. The third greatly revised and expanded version, Genevestigator V3, was recently made available on-line.. The new version was developed in close collaboration with Professor Peter Widmayer’s group at the Institute of Theoretical Computer Science. Tomas Hruz, a computer scientist and head of software development in this project, was responsible for the software architecture and for developing special algorithms. The new architecture enables thousands of users every day to gain efficient access to chip data. In principle, Genevestigator is an Internet-based visualisation tool and a data base containing as many as possible of the gene expression data of various organisms published so far. It now covers 6,000 chip data sets for the mouse and the quintessential model plant, thale or mouse-ear cress, Arabidopsis thaliana, and will soon be expanded to include data for rats, barley and humans. A further 4,000 data sets will be added to it by the end of April this year. Looking for a needle in a data stack The two scientists Zimmermann and Hruz stress that “We regard data quality as very important”. Since the chips originate from many different laboratories, they need to check them to weed out the bad ones. Zimmermann explains that “We use statistical methods to mark bad chips”. Users can choose whether they want to view all the data sets or only the ones of good quality. The program enables researchers to organise the available data meaningfully so they can recognise when and under which circumstances certain families of genes are active. Genevestigator can provide information about which genes are active at a certain stage of development or in particular diseases. This enables scientists to make a targeted search for marker genes, for example to track down a heart attack marker gene from the plethora of information.
|
Zimmermann says “The search for marker genes has shown up interesting links between a heart attack and other factors.” He says Genevestigator is the right tool to find such genes or links. Hand-picked metabolic data The new Genevestigator can also recognise gene clusters, i.e. a group of genes showing a similar response under certain circumstances. For example the software organises genes so as to correspond with the anatomy, allowing the researcher to recognise at a glance which group of genes was active in which plant organs. However, Genevestigator can also display entire metabolic and regulatory metabolic pathways. The software draws metabolic maps as large networks of interconnected reactions. This was a big challenge for the programmers working with Tomas Hruz, who was responsible for the information science. They needed to create their own special algorithms for this. The computer science researcher says “The structures and properties of this network are very similar to those of the Internet.” In addition the biologist Oliver Laule put a great deal of effort into checking all the metabolic pathways stored in the data base against the literature. Zimmerman stresses that “As a result we have achieved very high data quality.” In the long term he and his colleagues want to be able to model the metabolic pathways. The ETH Zurich researcher says “However, at the moment it is mainly a visualisation tool.” Graphics can be downloaded as image or vector files for publications. Greatly expanded Genevestigator originates from an idea by Philip Zimmermann and began in 2004. He explains that “I asked myself how we would need to combine these millions of measurements to enable a biologist to obtain an overview of the activity of genes quickly and easily.” Planning and implementing Genevestigator required close collaboration between biologists, mathematicians and computer scientists. In January 2004 the team developed an initial version and made it available on-line the following June. The tool has been under constant development and expansion by the Genevestigator team since. The ETH Zurich researchers put the new version onto the Internet as a technical release on 20 February 2007. The version with new data and organisms will go on the Net in late April. V3 is based on a completely new data base model. This reorganisation allows almost unlimited amounts of data to be processed, so that Genevestigator can be expanded to any desired number of organisms. A much-cited publication Genevestigator is a success. The paper about the tool published in September 2004 in “Plant Physiology”, historically the most important scientific journal of plant sciences, has already been cited 300 times and according to Citations Index it is the third most frequently cited publication in this journal in the last 80 years. (2) Interest on the part of other scientists is continually increasing. The 1,000th user registered in October 2004. Zimmermann says “The number of users has increased linearly since then, although we had really expected interest to plateau out sooner or later.” The data base now has 10,400 registered users, 8,300 of them active. ETH Zurich has financially supported the project the last two years. Therefore it is to remain a community tool for the time being, and Genevestigator Classic will continue to be available to academics free of charge. The sale of licences for Genevestigator Advanced after it goes on-line at the end of April is intended to ensure its sustained development. Since some of Genevestigator’s functions are also very useful for industrial applications, several pharmaceutical companies have already licensed access to the software. |
||||||
|
Footnotes:
You can write a feedback to this article or read the existing comments. | |||||||