|
| ||||||||||||||||||||||||||||||||||||||||||||||
|
Section: Science Life |
deutsche Version  Print-Version |
|
Interactive"Atlas der Schweiz 2": expanded and presented in Berne 1000 maps: 1000 possibilities | |
|
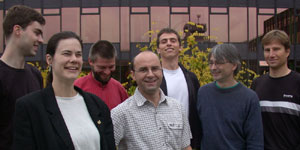
Since its first publication in 2000 the interactive Swiss atlas, "Atlas der Schweiz–interactive", has been awarded six prizes. According to cartographers from ETH Zurich it has established itself worldwide as a leading product of Swiss cartography. A new edition of the atlas, with 1'000 maps and around 1'000 themes, was presented to the public (2) on 18th November, in the presence of Ueli Suter, ETH Vice-president Research, Lorenz Hurni, ETH professor and editor-in-chief of the "Atlas der Schweiz" and René Sieber, who headed the project. By Regina Schwendener "In the future a multimedia version on CD-ROM of the classic 'Atlas der Schweiz' will also be available. The Institute of Cartography at ETH Zurich (1) has handed in a corresponding research application. On 11th November 1997, Professor Lorenz Hurni had presented a prototype of the atlas in his inaugural lecture entitled, 'From printed map to a multimedia atlas'. This was the starting signal for a new generation of atlases. More than 13,000 copies of "Atlas der Schweiz–interactive" (3) had been sold by October 2003. To date, it has received six awards, both national and international. Now the newest version is available and was presented to the public on 18th November in Berne. The prototype had already picked up two first prizes, the "Excellence in Cartography" prize from the jury of experts and the Public's Prize at the International Cartographic Conference 2003 in Durban. A Further milestone A team of eight specialists, (three software developers, three editors and two cartographers), with the decisive support of the ETH Board, ETH Zurich, swisstopo (4) and the Federal Office of Statistics, have succeeded in creating something that is unique worldwide. Head of the project, René Sieber, is convinced, "With its second interactive version, the 'Atlas der Schweiz' sets another milestone in the field of cartography". It has been completely revised; the original 250 map themes expanded to over 1,000 and it is in four languages. "The internal structure of the program and the graphic user interface have been newly designed. As was the case for the first edition, all cartographic program modules were especially developed for this atlas at the ETH Institute of Cartography," says Sieber.
|
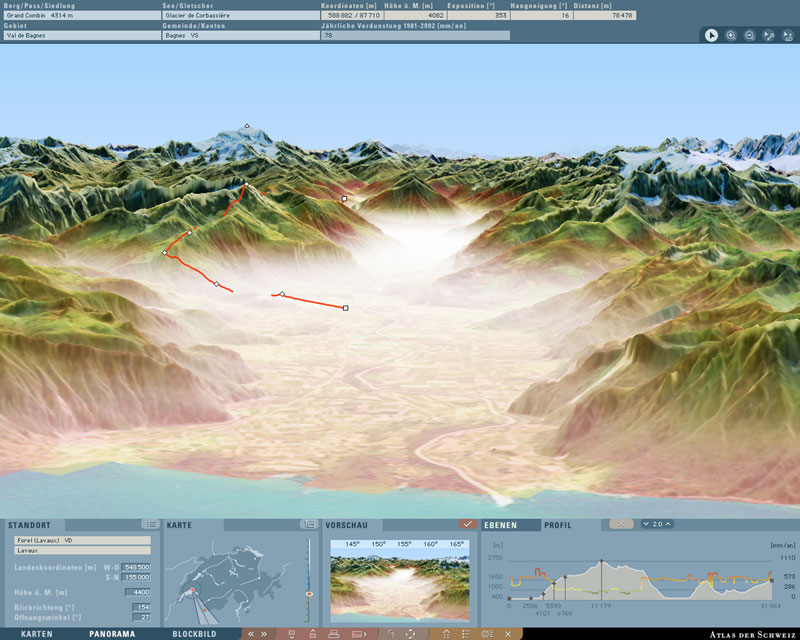
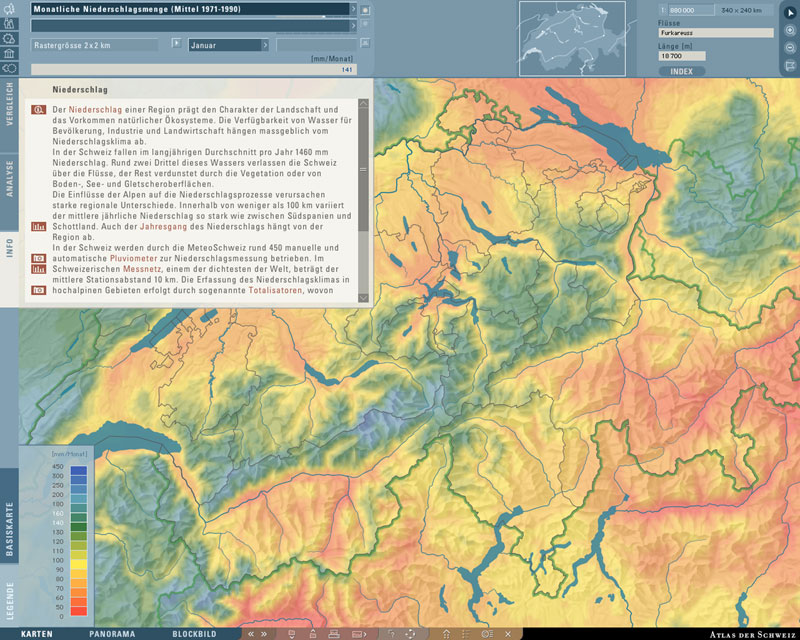
Some practical innovations The interactive raster map was developed as a new type of map. What this means is that the map is computed and displayed directly from the raster data. This enables a number of options when it comes to the presentation: the transition from one raster cell to the next can be maintained and remains visible (sharp contours, non-interpolated colours), for example, of the use of land, or the transition is smoothed out (interpolated, graduated colours), for rain, for example. These techniques allow the user to choose the appropriate presentation for each type of raster data. A further innovation is the interactive landscape profile. A profile line, which can be changed at any time, can be laid over the landscape. New points can be introduced into the profile line, moved or deleted. The profile fits snugly into the landscape so that the run of the profile is already very realistic on the 3D map. The profile can be displayed in its own panel and can then be retrieved interactively. Themes expanded It was already an exhilarating experience to surf through the landscape and themes of the first edition of the atlas and to investigate background information. The themes have now been expanded and now include a new area–nature and environment. Over 100 public institutions and offices, research institutes and private organisations provided data, basic maps or accompanying multimedial material, says Sieber. Does any special work spring to mind? No problem for the project's head: " New themes were integrated in the 2D section, which included data from the 2000 census, as well as a host of interesting data on the weather and climate, geology and raw materials, soil, water, ice and snow, landscape, flora and fauna." The 3D section shows panoramic views and block diagrams from a range of angles which are overlaid with diverse themes. Once it is displayed on the screen, the map, for example of the Maggia valley in fog, can be viewed at different altitudes, hard shadow, slope gradient and landscape profile–the user chooses and the result is immediately calculated and displayed. In addition, different map themes can be compared and additional information in text, pictures and sound can be retreived. It's a fascinating way of doing research and one that enhances and encourages a more intensive interaction with the matter in hand. The 2D and 3D maps can be analysed and combined in manifold, but simple-to-use, ways, shaped according to one's own wishes, saved, exported and printed. This means that there are thousands of different ways to discover various aspects and views of Switzerland and to make further use of the information, as the cartographers predict in the book that comes with the program, not without–fully justified–pride.
|
|||||||||||||
|
Footnotes:
You can write a feedback to this article or read the existing comments. | ||||||||||||||